Executive Summary
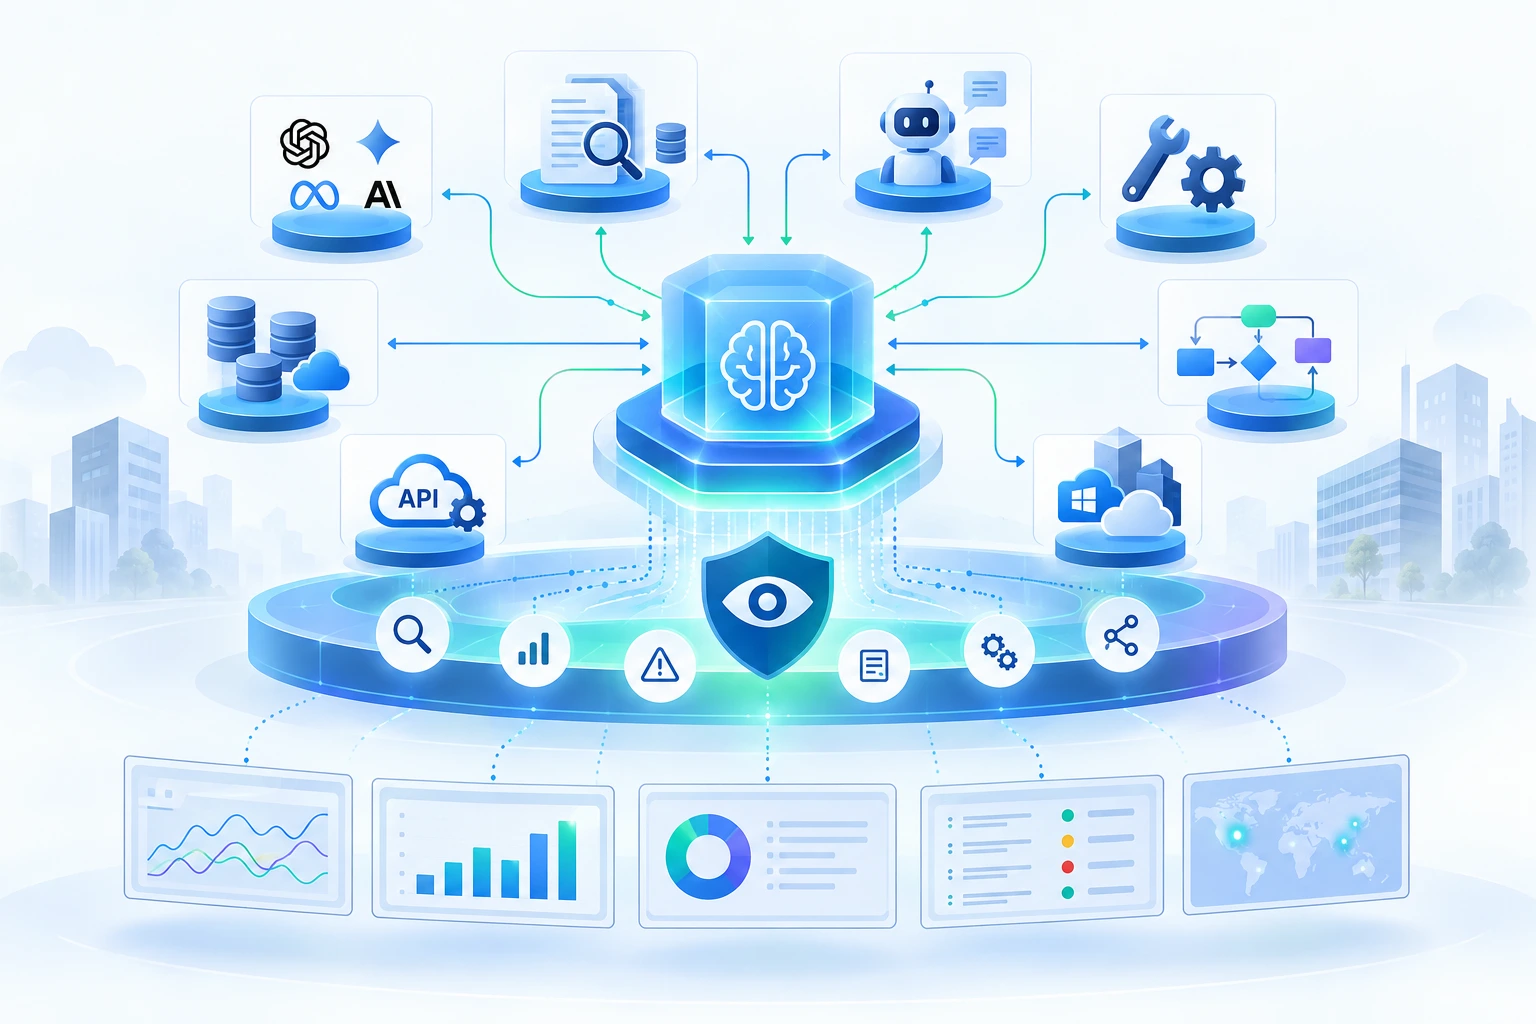
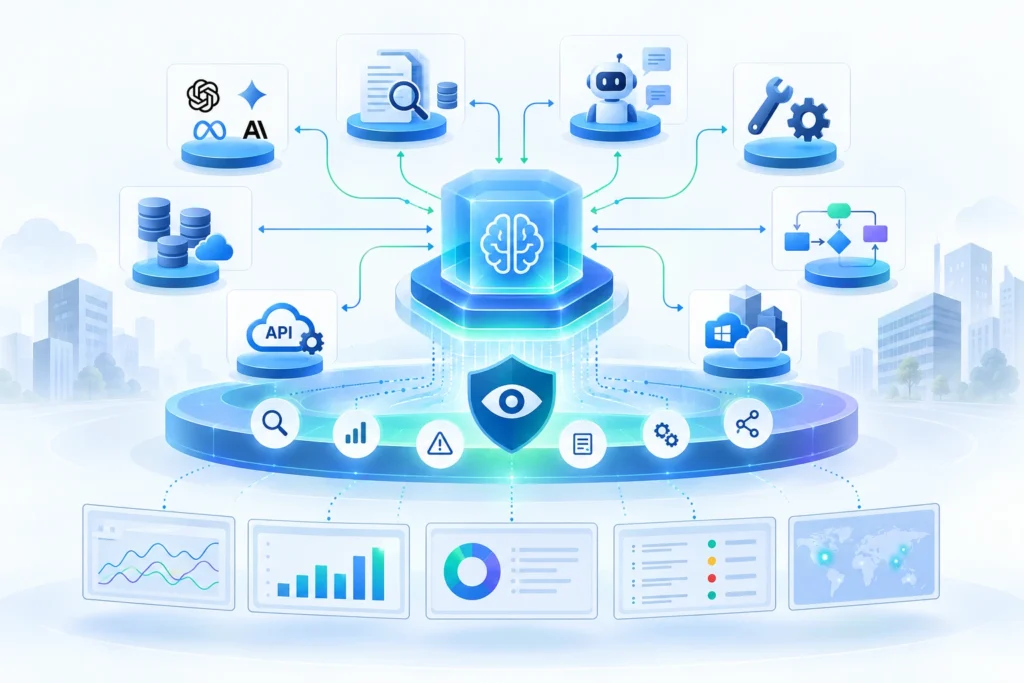
AI observability is the practice of monitoring the behavior, performance, quality, cost, security, and reliability of AI applications in production. Unlike traditional application monitoring, it must trace what happened inside the AI system—including model calls, prompts, retrieved context, tool calls, agent decisions, workflow steps, token usage, latency, errors, and final outcomes.
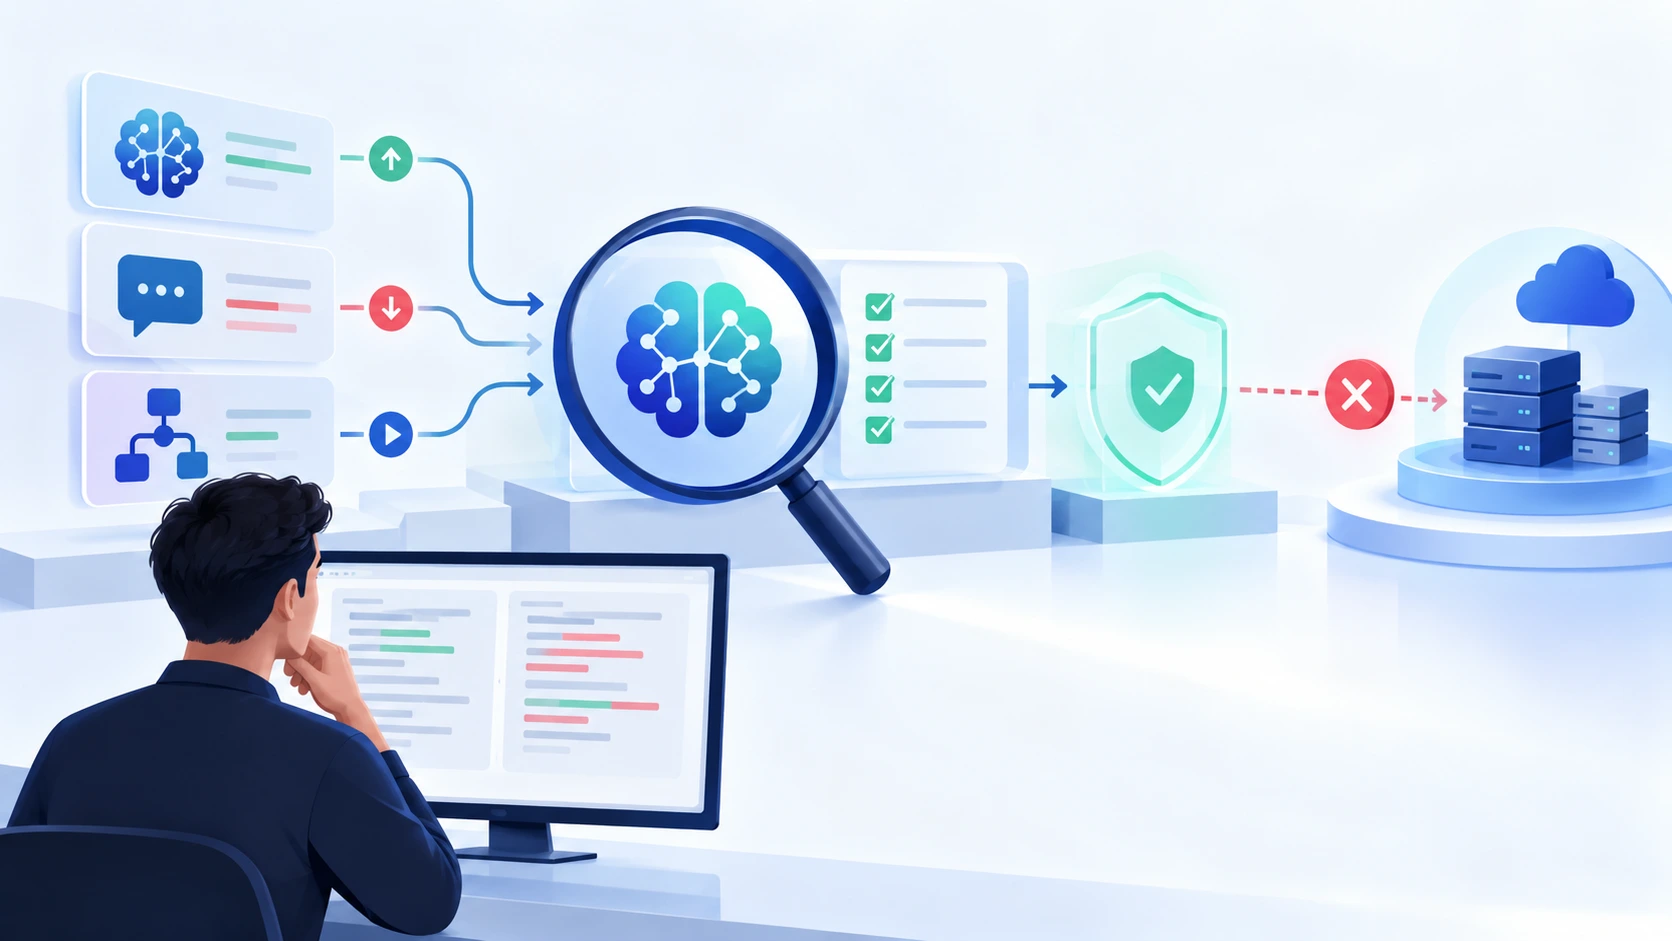
This distinction matters because an AI application can return a successful HTTP response while producing an incorrect answer.
A production AI system may fail because:
- The wrong model was selected.
- A prompt changed.
- Retrieval returned irrelevant documents.
- Context was incomplete.
- A tool timed out.
- An agent entered a retry loop.
- Token consumption increased.
- The model hallucinated.
- A guardrail blocked a legitimate request.
- An otherwise correct answer violated a business rule.
Traditional monitoring may show 200 OK.
AI observability needs to explain why the AI behaved that way and whether the outcome was actually useful.
OpenTelemetry’s current GenAI observability work standardizes telemetry around model calls, token usage, latency, prompts, completions, and tool interactions, providing a vendor-neutral foundation for tracing AI applications.
TL;DR
- AI observability extends traditional observability to AI-specific behavior and outcomes.
- Monitor models, prompts, retrieval, tools, agents, workflows, infrastructure, cost, and business outcomes.
- A successful API response does not necessarily mean a successful AI interaction.
- Use distributed traces to follow a request from the user through retrieval → model → tools → agent decisions → final response.
- Track AI-specific metrics including tokens, latency, model usage, hallucination/groundedness signals, tool failures, cost, and task success.
- Version prompts, models, datasets, retrieval indexes, agent instructions, and workflow configurations so production regressions can be traced to changes.
- Protect sensitive prompts, responses, tool arguments, and retrieved context through appropriate privacy and access controls.
- For agents, monitor trajectory and actions, not only the final response.
- Connect technical telemetry to business KPIs so teams know whether AI is actually delivering value.
- Build a closed loop: Observe → Diagnose → Evaluate → Fix → Deploy → Observe.
What Is AI Observability?
AI observability is the ability to understand what an AI application did, why it did it, how well it performed, what it cost, and whether its output met the intended business objective. It combines traditional traces, metrics, and logs with AI-specific signals such as model versions, prompts, tokens, retrieval context, tool calls, agent trajectories, evaluations, and response quality.
Traditional observability asks:
Is the application healthy?
AI observability asks:
Is the AI application healthy, reliable, accurate, safe, efficient, and producing the intended outcome?
That requires visibility across multiple layers.
The AI Observability Stack
Application → Workflow → Agent → Retrieval → Model → Infrastructure → Business Outcome
Each layer can introduce a different failure.
Why Traditional Application Monitoring Is Not Enough for AI Observability
Traditional application monitoring focuses on deterministic signals such as uptime, errors, CPU, memory, latency, and throughput. AI applications require additional visibility because a technically successful request can still produce an incorrect, unsafe, irrelevant, or unnecessarily expensive result.
Consider an enterprise RAG assistant.
A user asks:
“What is our current refund policy?”
The API responds successfully.
But the AI may have:
- Retrieved an outdated policy.
- Passed irrelevant documents to the model.
- Generated an unsupported answer.
- Failed to cite the correct source.
- Consumed 4× the expected tokens.
From a conventional monitoring perspective:
Request = successful
From an AI observability perspective:
Business outcome = failed
AWS recommends monitoring generative AI applications across application/system health, AI quality, and production feedback loops, including latency, throughput, cost, accuracy, relevance, hallucination rates, drift, traceability, and versioning.
Read our blog on AI-Powered Testing vs. Traditional Load Testing.
What Should You Monitor in an AI Application?
A production AI observability strategy should monitor seven dimensions: application health, model behavior, prompts and context, retrieval, agents and tools, cost and performance, and business outcomes. These dimensions should be correlated through a common request or trace ID so teams can diagnose problems across the entire AI workflow.
| Layer | What to Monitor | Example Signals |
|---|---|---|
| Application | Runtime health | Errors, uptime, throughput |
| Model | Inference behavior | Model, latency, tokens, finish reason |
| Prompt | Prompt changes | Version, template, token size |
| RAG | Retrieval quality | Relevance, recall, source quality |
| Agent | Reasoning/workflow | Steps, tool calls, retries |
| Tools | External actions | Success, latency, failures |
| Cost | AI economics | Cost/request, token usage |
| Quality | AI output | Accuracy, groundedness, relevance |
| Security | AI risk | PII, injection, policy violations |
| Business | Outcome | Resolution, conversion, task completion |
This is the foundation of enterprise AI observability. OpenTelemetry’s 2026 GenAI observability guidance identifies standardized telemetry for model identity, token consumption, latency, finish reasons, prompts, completions, and tool interactions.
1. Monitor AI Models
Model observability tracks which models are being used, how they perform, how much they cost, and whether changes in model behavior affect application quality. Model monitoring should cover latency, token consumption, errors, throttling, model version, request volume, and quality metrics rather than treating the LLM as a black box.
Track:
- Model name/version
- Provider
- Input tokens
- Output tokens
- Total tokens
- Request latency
- Time to first token
- Error rate
- Timeout rate
- Rate limits
- Finish reasons
- Cost
- Quality/evaluation scores
OpenTelemetry’s GenAI semantic conventions include model identity, token usage, operation duration, and response metadata as observable attributes.
Why model monitoring matters
A model upgrade can change:
- Accuracy
- Response style
- Tool selection
- Token consumption
- Latency
- Safety behavior
- Cost
Therefore:
Model change = production change
Treat it accordingly.
2. Monitor Prompts and Context
Prompt observability tracks how prompt templates, system instructions, context size, retrieved information, and prompt versions affect AI behavior. This is essential because a prompt change can cause production regressions even when application code remains unchanged.
Track:
- Prompt version
- System instructions
- User input
- Context size
- Input-token count
- Retrieved sources
- Context relevance
- Prompt-template changes
- Model parameters
- Output quality
For example:
Prompt v12 → groundedness 94%
Prompt v13 → groundedness 86%
Traditional infrastructure monitoring may never identify this regression.
AI observability can correlate the quality decline with the prompt deployment.
Important privacy consideration
Prompt and response content can contain:
- Customer information
- Personal data
- Confidential business information
- Secrets
- Financial information
- Proprietary documents
OpenTelemetry notes that GenAI telemetry can capture prompt and completion content when explicitly enabled, but these fields can contain sensitive information and therefore require deliberate configuration.
Do not automatically capture everything simply because it is technically possible.
Use:
- Redaction
- Masking
- Sampling
- Access controls
- Data retention policies
- Sensitive-data classification
3. Monitor RAG and Retrieval Quality
RAG observability monitors whether an AI application retrieved the right information before generating an answer. It separates retrieval failures from generation failures, making it possible to determine whether a hallucination originated from poor context, incorrect retrieval, or model behavior.
A useful RAG trace is:
Question → Query transformation → Retrieval → Reranking → Context assembly → Model → Answer
Monitor:
- Number of documents retrieved
- Retrieval latency
- Retrieval relevance
- Ranking scores
- Source freshness
- Duplicate documents
- Context size
- Citation coverage
- Groundedness
- Retrieval failures
Example
A customer asks:
“Can I return this product after 45 days?”
The model produces an incorrect answer.
Without RAG observability, the team may blame the LLM.
With tracing, they discover:
Retrieved policy → outdated 60-day policy
while the current policy states:
30-day return period
The root cause was retrieval, not necessarily the model.
This is why AI observability should trace the complete chain.
4. Monitor AI Agents and Their Trajectories
AI agent observability monitors the sequence of decisions, model calls, tool invocations, retrieved information, retries, and actions that occur while an agent completes a task. Monitoring only the final answer is insufficient because an agent can reach the correct result through an inefficient or unsafe trajectory—or fail after several hidden intermediate actions.
Consider:
User Request
     ↓
Agent
     ↓
LLM Call
     ↓
Search Tool
     ↓
CRM Tool
     ↓
LLM Reasoning
     ↓
Payment Tool
     ↓
Validation
     ↓
Final Response
A conventional application log may record:
Request completed in 32 seconds
AI observability should reveal:
- 5 model calls
- 3 retrieval operations
- 2 CRM calls
- 1 failed tool call
- 2 retries
- 18,000 input tokens
- 3,000 output tokens
Now engineering teams can identify the actual problem.
OpenTelemetry’s AI-agent observability guidance emphasizes tracing agent operations and using telemetry as a feedback loop for improving agent quality.
5. Monitor AI Workflows End to End
AI workflow observability connects individual model calls, retrieval operations, APIs, business systems, and agent actions into a single end-to-end trace. This allows teams to identify which step caused latency, errors, cost increases, or poor business outcomes.
For example:
Customer Query
      ↓
Intent Classification
      ↓
Knowledge Retrieval
      ↓
LLM Call
      ↓
CRM Lookup
      ↓
Agent Decision
      ↓
Workflow Action
      ↓
Customer Response
A useful trace should answer:
- What triggered the workflow?
- Which model was used?
- What context was retrieved?
- Which tools were called?
- How long did each step take?
- Which step failed?
- How many retries occurred?
- What did the workflow cost?
- Did the business action succeed?
This turns AI debugging from guesswork into evidence-based diagnosis.
The AI Observability Trace
A useful production trace can be structured like this:
Trace: customer_support_84721

├── Intent Classification
│   ├── Model: Model-A
│   └── Latency: 420 ms
│
├── Retrieval
│   ├── Knowledge Base
│   ├── Documents Retrieved: 8
│   └── Reranked: 3
│
├── LLM Generation
│   ├── Model: Model-B
│   ├── Input Tokens: 3,240
│   ├── Output Tokens: 512
│   └── Latency: 2.8 sec
│
├── CRM Tool
│   ├── Status: Success
│   └── Latency: 310 ms
│
└── Final Response
    ├── Groundedness: 96%
    ├── Policy Check: Pass
    └── Task Success: Yes
This is much more useful than a single application log:
POST /chat → 200 OK
6. Monitor AI Quality, Not Just Infrastructure
AI quality monitoring measures whether the application continues to produce useful, accurate, relevant, grounded, safe, and policy-compliant outputs after deployment. Because AI behavior can change with prompts, models, data, users, and retrieval sources, quality must be monitored continuously rather than evaluated only before launch.
Useful quality metrics include:
- Accuracy
- Relevance
- Groundedness
- Factual consistency
- Citation accuracy
- Task completion
- Refusal accuracy
- Toxicity
- Safety violations
- PII leakage
- Human feedback
- User satisfaction
Quality monitoring can use three mechanisms
Automated evaluation
Use deterministic tests, LLM-as-judge evaluations, and domain-specific evaluators.
Human evaluation
Experts review high-risk or ambiguous outputs.
Production signals
Use user feedback, corrections, escalations, and business outcomes.
The strongest systems combine all three.
7. Monitor Cost and Token Economics
AI observability must include cost because token consumption, model selection, retries, context size, and agent trajectories can materially change the economics of production AI.
Track:
- Cost per request
- Cost per workflow
- Cost per user
- Input tokens
- Output tokens
- Model-specific cost
- Retry cost
- Tool cost
- Infrastructure cost
- GPU utilization
AWS CloudWatch’s current generative AI observability capabilities include token usage, latency, error rates, and cost attribution across applications and user dimensions.
Example
Suppose an AI support workflow costs:
$0.04/request
After a prompt update:
$0.11/request
The application may still be functioning correctly.
But at 5 million requests:
Old cost: $200,000
New cost: $550,000
That is an observability problem as much as a FinOps problem.
8. Monitor AI Security and Governance
AI observability should capture security and governance signals alongside performance data. Enterprise AI systems may expose sensitive data, invoke privileged tools, or interact with regulated workflows, making traceability and access controls essential.
Monitor:
- Prompt-injection attempts
- Sensitive-data exposure
- PII detection
- Unauthorized tool calls
- Permission failures
- Guardrail violations
- Suspicious agent behavior
- Excessive autonomy
- Policy violations
- Data access patterns
For agentic applications, monitor not only:
What did the agent say?
but also:
What did the agent do?
This distinction becomes critical when an AI system can modify records, initiate transactions, send messages, execute code, or interact with infrastructure.
AI Observability Metrics: The Enterprise Scorecard
A practical enterprise AI observability scorecard should combine technical health, AI quality, security, cost, workflow performance, and business outcomes. No single metric is sufficient because a system can be fast and available while still producing poor answers or unsafe actions.
| Category | Core Metrics |
|---|---|
| Availability | Uptime, error rate, SLA/SLO |
| Latency | P50, P90, P95, P99 |
| Model | Model version, inference latency, failures |
| Tokens | Input/output tokens |
| Cost | Cost/request, cost/workflow |
| RAG | Retrieval precision, recall, relevance |
| Quality | Accuracy, groundedness, relevance |
| Agents | Task success, retries, tool calls |
| Tools | Success rate, latency, failures |
| Safety | Violations, PII, injection attempts |
| Workflow | Completion rate, failure rate |
| Business | Resolution, conversion, revenue, productivity |
AWS recommends monitoring application health, AI quality, business metrics, and feedback loops together rather than treating AI monitoring as a single technical dashboard. AWS’s current production guidance organizes GenAI monitoring around application/system health and AI quality, including latency, throughput, resource utilization, cost, accuracy, relevance, hallucinations, drift, explainability, and traceability.
Read our blog on AI-Native DevOps: How to Build CI/CD Pipelines for AI-Powered Applications
How to Build an AI Observability Architecture
A production AI observability architecture should capture telemetry from the application, orchestration layer, retrieval systems, models, tools, and infrastructure, correlate the signals into end-to-end traces, and connect them to evaluation and business metrics.
Here is a practical architecture
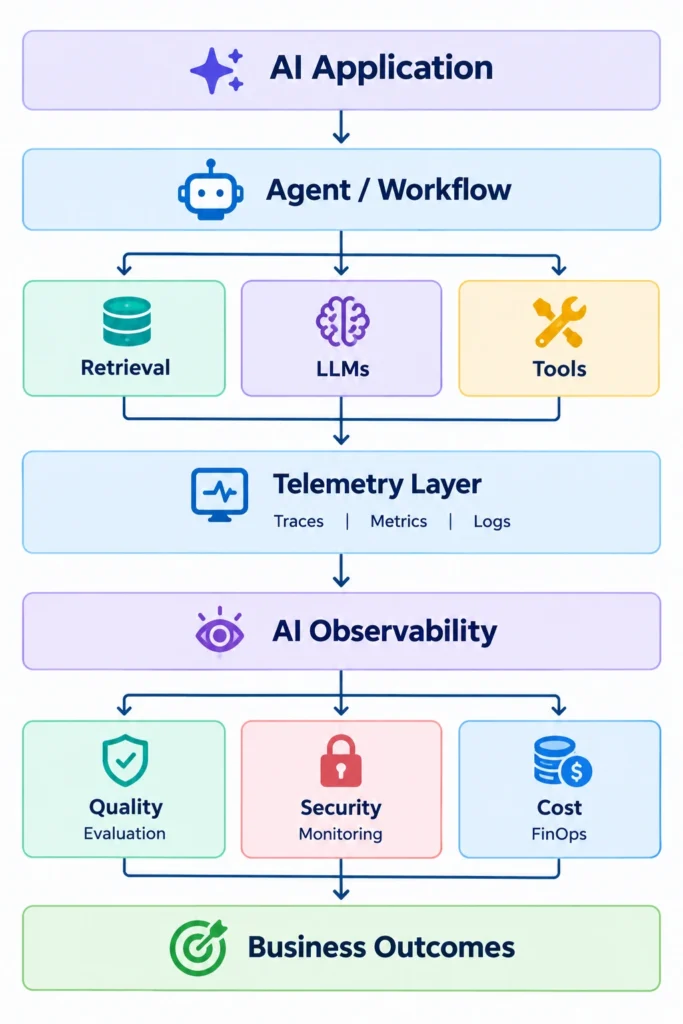
OpenTelemetry provides a useful vendor-neutral foundation because its semantic conventions standardize common names and attributes for telemetry, while its GenAI work extends this approach to model and agent operations.
OpenTelemetry for AI Observability
OpenTelemetry is becoming an important foundation for interoperable AI observability because it provides standardized telemetry conventions for GenAI operations rather than tying application instrumentation to one observability vendor.
Current GenAI semantic conventions include signals such as:
- Model used
- Operation duration
- Input tokens
- Output tokens
- Finish reasons
- Prompt/messages when content capture is enabled
- Tool calls and results
OpenTelemetry’s 2026 guidance demonstrates traces where an agent invocation contains child spans for LLM calls and tool execution, making the internal path of an AI request visible.
This matters for enterprises operating:
- Multiple model providers
- Multiple AI frameworks
- Multi-cloud environments
- RAG systems
- AI agents
- Custom orchestration layers
A standardized telemetry layer reduces observability fragmentation.
How to Monitor AI Prompts Safely
Prompt observability should provide enough information to diagnose AI behavior without unnecessarily exposing sensitive enterprise or customer data. Enterprises should classify prompt and response telemetry, apply redaction or masking, restrict access, and retain detailed content only when its diagnostic value justifies the risk.
A practical policy can divide telemetry into three levels:
| Level | Captured Data | Use |
|---|---|---|
| Level 1 | Metadata only | Default production monitoring |
| Level 2 | Redacted content | Debugging and quality analysis |
| Level 3 | Full content | Restricted troubleshooting/evaluation |
This creates a useful principle:
Observe AI deeply without creating a second data-leakage surface.
OpenTelemetry explicitly notes that prompt and tool content can contain sensitive information and therefore is not captured by default in its current GenAI telemetry walkthrough.
How to Detect AI Regressions in Production
AI regressions occur when a new model, prompt, retrieval index, dataset, tool, or workflow version causes measurable deterioration in application behavior. AI observability should correlate production quality changes with the exact version of the artifact that changed.
Track:
Application version
Prompt version
Model version
RAG/index version
Tool version
Evaluation version
This enables questions such as:
“Did groundedness decline after the model upgrade?”
“Did cost increase after the prompt change?”
“Did task completion fall after the retrieval index refresh?”
“Did tool-call errors increase after changing the agent instructions?”
Without version-aware observability, these questions become difficult to answer.
AI Observability for AI Workflows
AI workflow observability extends beyond individual LLM calls to measure the performance and business outcome of an entire automated process. This is essential when AI is embedded into enterprise workflows such as claims processing, customer support, invoice processing, sales operations, or software engineering.
For example:
Invoice workflow
Invoice received → OCR → Classification → Validation → ERP lookup → Exception detection → Approval → Posting
Monitoring only the LLM misses most of the workflow.
Instead measure:
- Processing time
- Extraction accuracy
- Validation failures
- ERP latency
- Human intervention rate
- Exception rate
- Cost per invoice
- Straight-through processing rate
This connects AI observability directly to business process performance.
AI Observability vs. AI Evaluation vs. Monitoring
| Capability | Monitoring | Evaluation | Observability |
|---|---|---|---|
| Runtime health | ✓ | — | ✓ |
| Metrics | ✓ | ✓ | ✓ |
| Offline quality testing | — | ✓ | ✓ |
| Root-cause analysis | Limited | Limited | ✓ |
| Distributed tracing | Limited | — | ✓ |
| Prompt analysis | Limited | ✓ | ✓ |
| Agent trajectory | Limited | ✓ | ✓ |
| Production feedback | ✓ | ✓ | ✓ |
| Business context | Limited | ✓ | ✓ |
| Cross-system diagnosis | Limited | — | ✓ |
Evaluation tells you whether the AI meets a quality criterion. Monitoring tells you whether the system is operating within defined conditions. Observability helps explain why the system behaved the way it did.
These capabilities should work together rather than compete.
A Practical AI Observability Implementation Roadmap
Enterprises should implement AI observability incrementally, starting with end-to-end tracing and core runtime metrics, then adding AI quality, security, cost, agent, and business-level monitoring.
Phase 1: Instrument the application
Capture:
- Request IDs
- Model calls
- Tool calls
- Retrieval calls
- Latency
- Errors
- Token usage
Phase 2: Build end-to-end traces
Connect:
User request → workflow → agent → retrieval → model → tools → response
Phase 3: Add AI quality metrics
Introduce:
- Groundedness
- Relevance
- Accuracy
- Task success
- Hallucination signals
Phase 4: Add security and privacy
Implement:
- PII detection
- Redaction
- Access controls
- Audit trails
- Prompt-injection monitoring
Phase 5: Add cost observability
Track:
- Token consumption
- Cost/request
- Cost/workflow
- Model-level economics
- Retry costs
Phase 6: Connect to business KPIs
Measure:
- Resolution rate
- Conversion
- Productivity
- Automation rate
- Human intervention
- Revenue impact
Phase 7: Automate response
Use thresholds to trigger:
- Alerts
- Rollbacks
- Model routing changes
- Workflow pauses
- Human escalation
- Evaluation jobs
Common AI Observability Mistakes
| Mistake | Why It Fails | Better Approach |
|---|---|---|
| Monitoring only uptime | AI can be wrong while infrastructure is healthy | Monitor quality |
| Logging only final answers | Hides retrieval/tool/agent failures | Trace the full workflow |
| Ignoring prompts | Prompt changes can alter behavior | Version and monitor prompts |
| Monitoring only models | AI failures often occur upstream/downstream | Monitor the entire chain |
| Capturing all content | Creates privacy/security risk | Apply data minimization |
| Ignoring tokens | Cost can increase invisibly | Track token economics |
| Monitoring agents by final output | Hides unsafe or inefficient trajectories | Trace actions and tools |
| Using one quality score | Hides specific failure modes | Track multiple dimensions |
| No business metrics | Technical success may not equal business value | Connect telemetry to outcomes |
| No feedback loop | Problems repeat | Feed production failures into evaluation |
10 High-Value AI Observability Metrics
For organizations building an initial dashboard, these metrics provide a practical starting point:
- P95 AI response latency
- AI request error rate
- Input/output tokens per request
- Cost per successful task
- Groundedness score
- Retrieval relevance
- Agent task completion rate
- Tool-call failure rate
- Human escalation rate
- Business outcome success rate
For higher-risk systems, add:
- PII exposure
- Policy violations
- Prompt-injection detection
- Unauthorized tool calls
- Hallucination rate
- Model drift
Read our blog on How to Build an Enterprise Context Layer for AI: Architecture, Steps & Best Practices.
The Future of AI Observability
AI observability is evolving from infrastructure monitoring into continuous intelligence about how AI systems behave, reason, act, and deliver business outcomes. As AI agents become more autonomous, enterprises will need observability that covers not only model calls but also context, memory, tools, decisions, workflows, and business actions.
The next generation of AI operations will increasingly combine:
Observability + Evaluation + Governance + FinOps + Security
into one continuous operational loop.
The mature AI production lifecycle becomes:
Build → Evaluate → Deploy → Observe → Diagnose → Improve → Re-evaluate
For enterprise AI, that loop is becoming as important as traditional CI/CD.
Key Takeaways
- AI observability is broader than LLM monitoring.
- Monitor the complete AI system: models, prompts, context, RAG, agents, tools, workflows, infrastructure, and outcomes.
- End-to-end traces are essential for diagnosing multi-step AI workflows.
- Model latency and token usage should be monitored alongside response quality.
- Prompt and model versions must be correlated with production behavior.
- RAG observability helps distinguish retrieval failures from model failures.
- Agent observability must capture actions and trajectories, not only final responses.
- AI observability must include privacy and security controls.
- Business metrics should sit alongside technical metrics.
- OpenTelemetry provides a useful foundation for standardized GenAI telemetry.
- Production AI requires a continuous observe → evaluate → improve feedback loop.
FAQs
1. What is AI observability?
AI observability is the practice of monitoring and tracing AI applications to understand their performance, behavior, quality, cost, security, and business outcomes in production. It extends traditional observability with AI-specific signals such as model versions, prompts, tokens, retrieval, tool calls, agent trajectories, and AI evaluations.
2. What is LLM observability?
LLM observability focuses specifically on understanding interactions with large language models, including prompts, responses, model versions, latency, token consumption, errors, and quality signals.
3. What should you monitor in an AI application?
Monitor application health, model calls, prompts, retrieval, context, agents, tools, tokens, latency, cost, AI quality, security events, workflow performance, and business outcomes.
4. How is AI observability different from traditional observability?
Traditional observability primarily monitors system health and application behavior. AI observability also monitors probabilistic behavior and output quality, including groundedness, relevance, hallucination signals, prompts, model changes, retrieval, and agent actions.
5. How do you monitor AI agents?
Trace the complete agent trajectory, including user input, model calls, memory retrieval, tool calls, tool results, retries, intermediate steps, final output, latency, cost, and task completion.
Related Reads
- AI-Native DevOps: How to Build CI/CD Pipelines for AI-Powered Applications
- Enterprise AI Governance Framework: Complete 2026 Guide for Responsible AI
- How to Build Enterprise AI Copilots: A Complete Guide for Business Leaders (2026)
- AI Agent Evaluation Frameworks Compared: Choosing the Right Platform for Enterprise AI in 2026
- Agentic vs copilot AI