
Join our Partner Rewards Program and reap
exclusive benefits for every successful
client
referral
Data Visualization Becoming Mainstream Adoption in Retail
Data is the new king, in all its sizes, shapes, bits and pieces. Every business wants to gather insights, manage, visualize, and analyze data to make informed decisions in various ways. Data doesn’t provide clear insight unless it is properly represented or is in accessible format which prevents users from using it efficiently.
Consequently, data visualization comes into play where expert analytics users delve into data to make smarter decisions. Data visualization is the representation of information or data using visual elements like charts, graphs, etc., to provide an accessible way to read data. This clearly explains its importance as it makes it easier to consume and interpret data readily.
In retail, data analytics have made it possible for retailers to understand how each department of retail works i.e., logistics, stores, sales, etc., with the help of various types of data like sales, inventory, operational data, and customer data. Data visualization in retail has fueled sales strategy, enhanced customer experience, and streamlined the entire retail process by determining the demographics of all points.
The retail industry has now adopted data-driven customization as data in social networks, online purchases, geo-tagged smart interactions, etc., are creating several suggestions. According to a report by Mordor Intelligence, the big data analytics in the retail market is expected to reach USD 13.26 billion by the end of 2026 at a CAGR of 21.20%.
In this age, data analytics and visual analytics will also help organizations achieve a better and faster understanding of customer journeys and help them improve customer experience (CX). Retail companies need to have a real-time tracker, to forecast trends by applying Big data analytics with data visualization.
With intensifying competition in the industry, visual analytics is likely to emerge as an inevitable tool for retailers to maintain and strengthen their position in the global market. Hence, the industry sees the burgeoning importance of business intelligence (BI) and data visualization tools in retail.
Let’s check how data visualization in retail will devise essential business strategies:
How is Data Visualization Changing Retail’s Business Strategies?
Leading retailers are looking to leverage business intelligence (BI) tools in data visualization analytics to identify and discern patterns, outliers, and underlying trends in large datasets. It’s important to note how embarking on a new data visualization journey will take retail analytics to the next level and gain an insight-driven advantage.
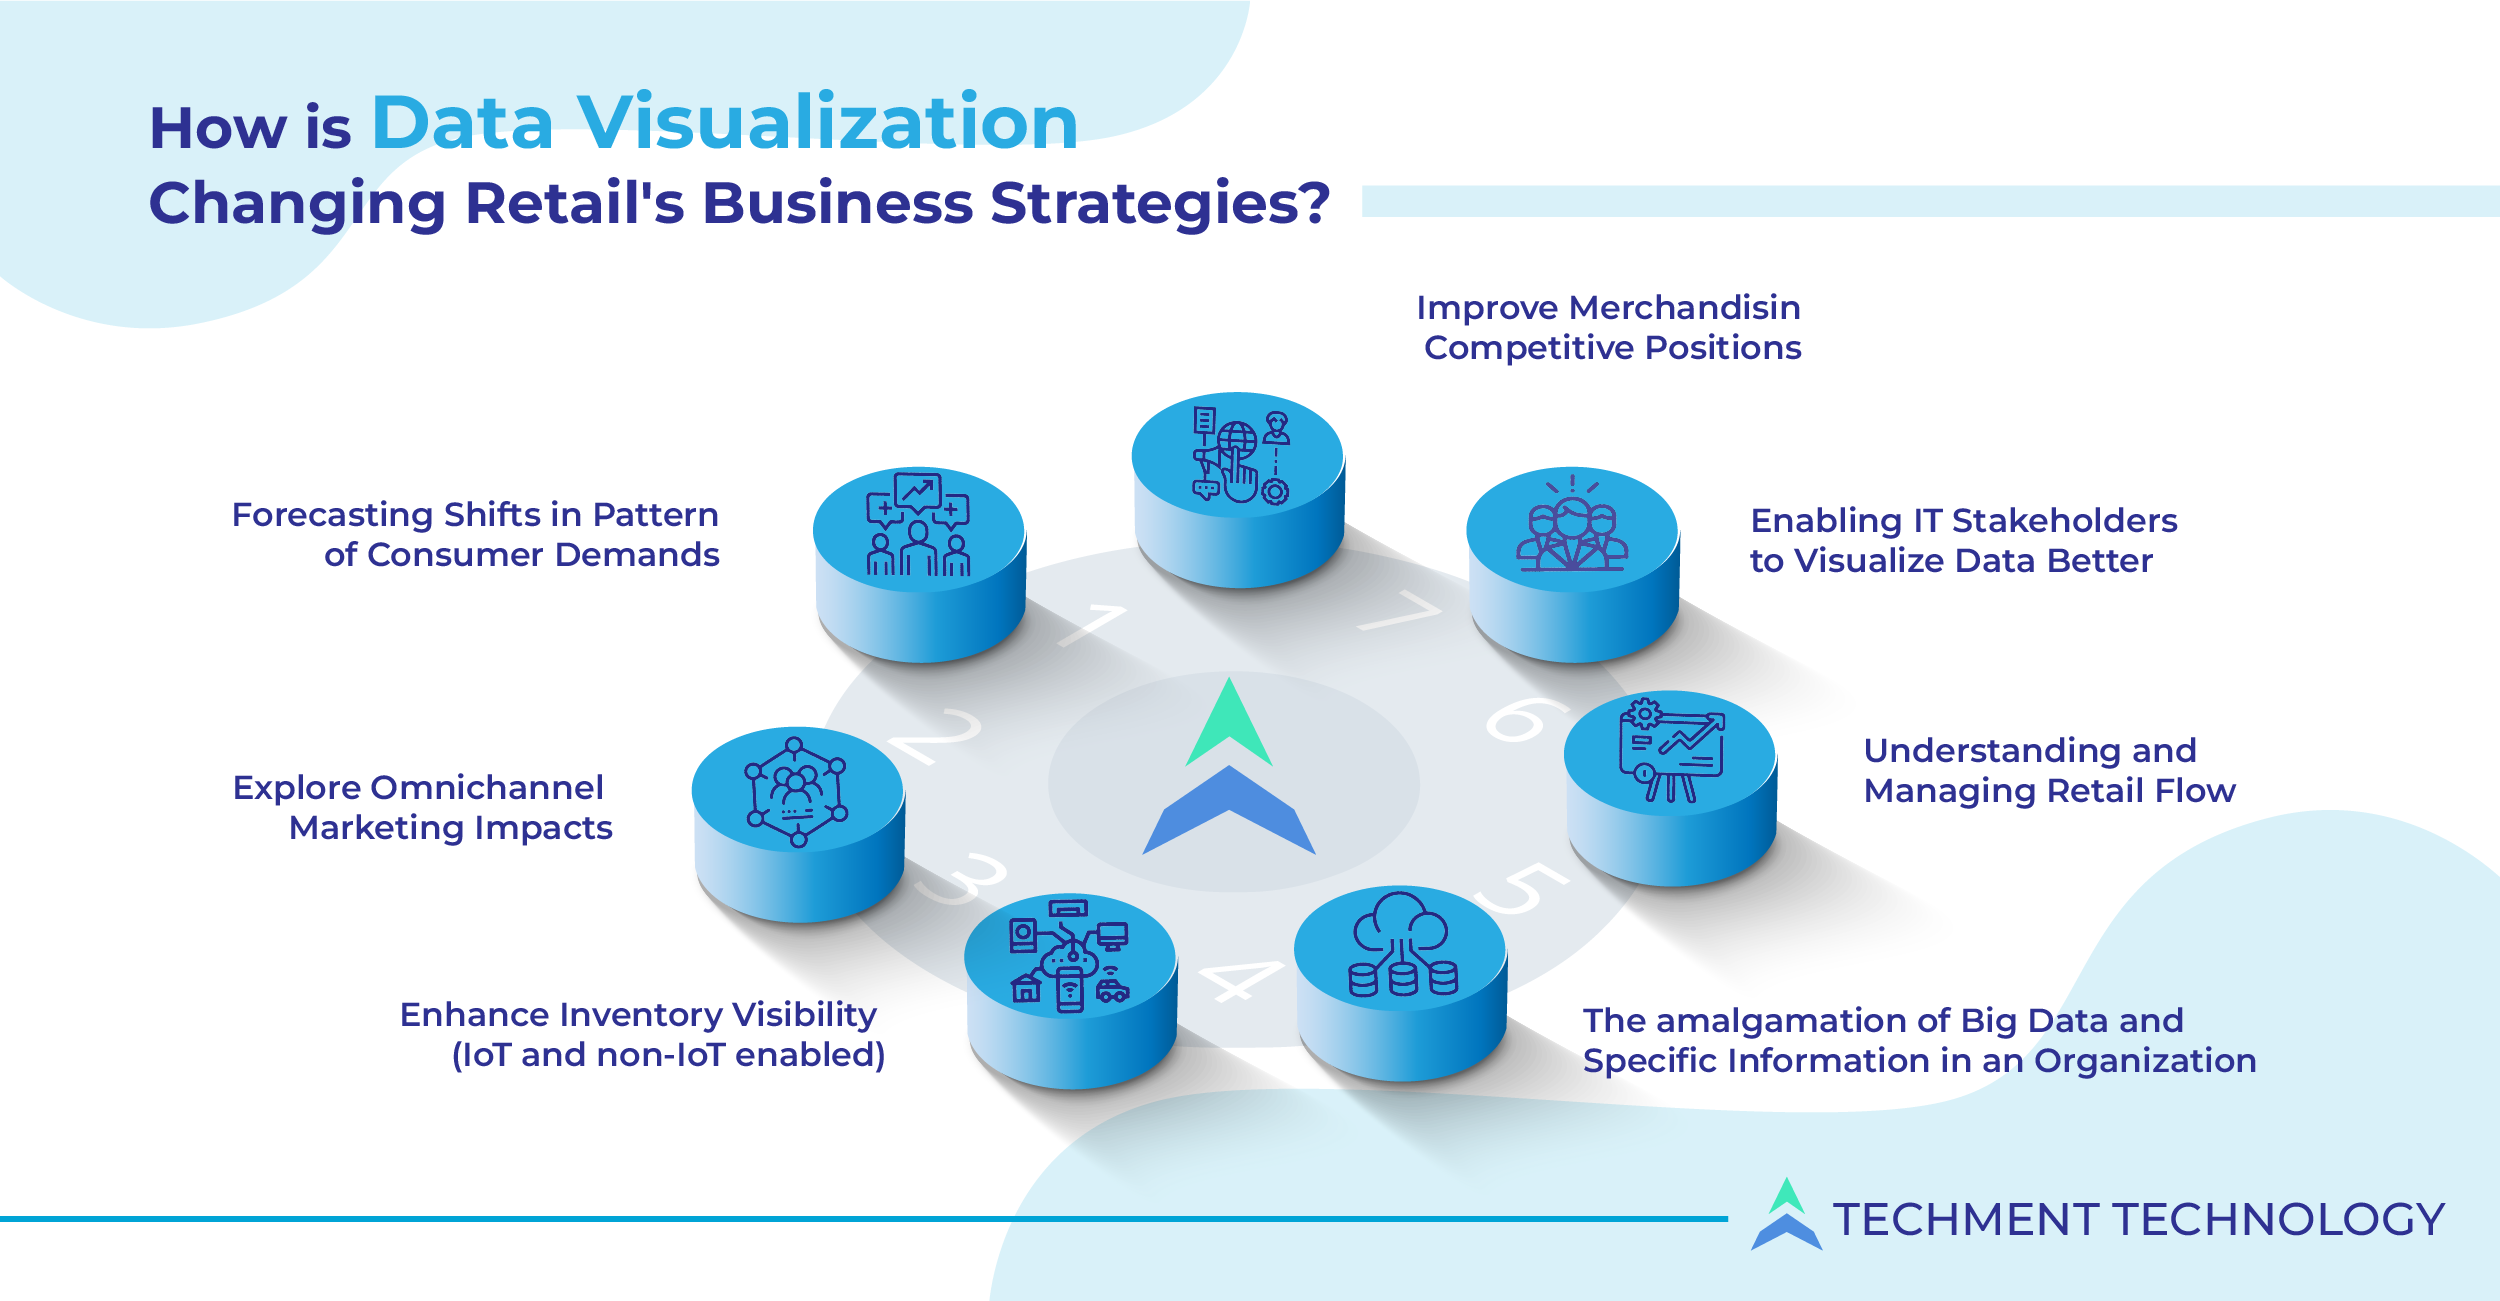
- Forecasting Shifts in Pattern of Consumer Demands: Serving varied customers is difficult as they demand better recommendations and personalization. Data visualization tools use data from IoT devices to gain detailed insights into customer behavior and operations to drive revenue by leveraging it. These tools are widely accessed to understand how and when the needs and demands of consumers will fluctuate in the coming future. This tells about consumers’ buying behavior, which helps bridge the supply-demand gap.
- Enabling IT Stakeholders to Visualize Data Better: Data visualization gives stakeholders, decision-makers, and business owners, a better prediction of sales volumes and future growth. The visualization process takes raw data, models it, and delivers insights so that conclusion is reached, which helps create machine learning (ML) algorithms to compile better data. This visual analytics encourages stakeholders to bring the entire team together, provide access to end-to-end data, and help them make data-driven decisions.
- The Amalgamation of Big Data and Specific Information of Organization: The world of retail and manufacturers are taking advantage of the amalgamation of big data comprising geographic information, demographics, and social media content) with visual analytics to expand information across predictive and prescriptive analytics.
This amalgamation helps interpret information, knowledge, and wisdom behind big data directly and effectively. With this amalgamation, it’s easy to understand graphic images through an interactive visualization interface and help data users understand and analyze. - Understanding and Managing Retail Flow: In retail, several departments are treated separately rather than synced, i.e., processes are fragmented. The method of streamlining these departments is error-sensitive and time-consuming. Having data visualized through tools would simplify and integrate the segregated departments. This can pinpoint where a business’s supply chain needs the most attention. It helps in handling specific problems and analyzing certain data points:
- Points of congestion in retail flow
- The efficiency of Distribution Center Placement
- Distribution Cost Analysis
- Enhance Inventory Visibility (IoT and non-IoT enabled): The platform aggregates the inventory data from inventory sensors and filters it to sales agent’s data source, allowing them to visualize fast movers, slow movers, and customer engagement with products. Concentrating on inventories with high and low-value stocks can make products available to customers in time, ultimately enhancing customer experience (CX).
- Improve Merchandising Competitive Positions: Companies can leverage the data visualization in retail to understand merchandising perceptions regarding pricing, trends, and styles.
- Explore Omnichannel Marketing Impacts: Visualization tools understand customer behavior as it relates to campaigns, using online and in-store data to create maps, charts and compare behavior. This helps to enhance customer experience, improve conversion rates, and enhance customer satisfaction simultaneously. This also allows the company real-time when a customer is having difficulty completing a conversion or another goal.
Retailers’ are struggling to keep pace with the current competition, especially in the online retail market. With this, the data of consumers and their purchase journey mounts up in every step and will further magnify in the coming years. Hence, retail needs to track data at all touch points and key performance indicators (KPIs) like sales strategy, revenue, product category, etc.; data adoption is vital for the industry.
Data Visualization Demands Advanced Analytical Configuration
Data Visualization is the smartest method to provide detailed information and gain valuable insights and has become a dynamic way of keeping big data consumable for business holders who are not data-savvy. This process lets the data users grasp intricate patterns and evaluate details as data has the prowess of visualization. It helps to integrate vast information into manageable bits of information that are easy to interpret.
With current technological advancements, data would be obtained through infinite new tactics, bringing more advanced analytical configurations. This will mean better insights of more meaning could be derived and carried on to all concerns. Numerical data are converted into images and texts, which would transform into numbers with the implementation of deep learning techniques. Such ascents will bring different departments in the retail industry closer to users, and they would be able to discover new areas of interest, ultimately enhancing customer experience (CX).
Techment Technology understands data and how to unlock it. Embarking on a new data visualization journey requires properly implementing data science to address critical questions systematically. Ready to begin your journey? Contact us to get started.
](https://www.techment.com/wp-content/uploads/2021/09/Top-6-Retail-Trends-01.png)