Join our Partner Rewards Program and reap
exclusive benefits for every successful
client
referral
In today’s fast-paced digital landscape, test automation reporting & analytics has become a cornerstone of quality assurance (QA) strategies. Businesses across industries face growing challenges in ensuring faster release cycles, improved test coverage, and reliable software quality. While test automation tools speed up execution, the real value emerges from how well teams measure, analyze, and act upon testing insights.
Accurate reporting and analytics in test automation allow organizations to track critical metrics, identify bottlenecks, and continuously improve their QA strategies. With the right framework, QA leaders and product managers can gain complete visibility into test health, optimize resource utilization, and prove the ROI of test automation to stakeholders.
Learn how Techment helps enterprises implement test automation successfully
TL;DR
- Test automation reporting & analytics is essential for QA visibility, efficiency, and decision-making.
- Metrics like test coverage analytics, bug detection efficiency, and ROI provide actionable insights.
- Detailed reports empower product managers, QA leaders, and CTOs with transparency.
- Modern tools provide real-time dashboards and predictive analytics for better planning.
- Common challenges include data overload, lack of alignment, and tool fragmentation—all solvable with structured frameworks.
Why Test Automation Reporting & Analytics Matters
Test automation reporting and analytics are crucial for any software development team, offering far more than a simple pass/fail log. They transform raw data into actionable insights, providing a clear window into the health of your application and the efficiency of your testing processes. This visibility is essential for making informed decisions, from daily debugging to long-term strategic planning.
Provides Visibility into Test Execution Outcomes
Effective reporting provides a comprehensive overview of test execution outcomes. Instead of a simple pass/fail, you get detailed information on why tests failed, which build they failed on, and their historical failure rates. This level of detail helps teams quickly pinpoint the root cause of issues, whether they are bugs in the application or flaky tests in the automation suite.
Identifies Inefficiencies and Uncovers Bottlenecks
By aggregating data across multiple test runs, these tools can identify recurring patterns and highlight areas of inefficiency. You might discover that a specific test suite consistently takes too long to run or that tests for a particular feature are frequently failing. These insights uncover bottlenecks that might otherwise go unnoticed, allowing you to optimize your test suite and streamline your development pipeline.
Enables Teams to Quantify Quality Assurance Efforts for Leadership
Reporting enables teams to quantify their quality assurance efforts in a way that resonates with business leaders. Metrics like test coverage, defect detection rates, and the number of automated tests executed per release provide tangible data points that demonstrate the value of the QA team. This moves the conversation from abstract concepts of “quality” to concrete, measurable outcomes.
Strengthens ROI Measurement and Justifies Automation Investments
Finally, this data is vital for measuring the Return on Investment (ROI) of your automation efforts. By tracking the time saved on manual testing, the number of defects caught early, and the reduced time-to-market, you can build a strong business case for continued or increased investment in test automation. This justification is critical for securing resources and proving that automation isn’t just a cost, but a powerful lever for business success.
According to Capgemini’s World Quality Report, 70% of organizations prioritize better analytics from QA processes as a critical driver of business value.
Explore our Test Automation Assessment to identify gaps in your current reporting.
Core Test Automation Metrics to Track
1. Test Coverage Analytics
- Measures how much of the application is tested by automation.
- Ensures coverage across functional, regression, integration, and edge cases.
- Example: A financial services company achieving 85% automated regression coverage can significantly reduce release delays.
2. Bug Detection Efficiency
- Tracks percentage of bugs found by automation versus production.
- Directly impacts customer experience and product quality.
- BrowserStack’s 2024 QA report highlights that early bug detection reduces remediation costs by up to 80%.
3. Automation Test Execution Reporting
- Provides execution times, pass/fail rates, and error logs.
- Helps QA teams identify flaky tests and system dependencies.
- Example report: “Out of 10,000 automated tests executed, 9,200 passed, 600 failed—450 of which were related to environment instability.”
4. ROI of Test Automation
- Calculated as time/cost savings versus automation investment.
- Critical for securing leadership buy-in and future investments.
- Formula: ROI = (Manual Hours Saved × Hourly Rate – Automation Investment) ÷ Automation Investment × 100%
Learn more: AI-powered test automation with Testim & Tricentis
Building Effective Reporting Frameworks
Define Objectives
- Align reports with business goals (e.g., faster releases, improved quality, cost savings).
Choose the Right Tools
- Tools like TestRail, Katalon, Tricentis Tosca, and Testim provide customizable dashboards.
- Gartner’s Magic Quadrant ranks leading platforms for automation efficiency.
Automate Reporting Pipelines
- Integrate with CI/CD tools like Jenkins or GitHub Actions.
- Enable real-time, auto-generated reporting to reduce manual effort.
Visualize with Dashboards
- Use charts, trend lines, and defect heatmaps.
- Example: A release readiness dashboard showing pass rates, critical bug density, and test coverage.
Industry Trends in Test Automation Analytics
- AI-driven insights: Predict defect-prone modules (McKinsey).
- Shift-left testing: Analytics integrated earlier in the SDLC.
- Cloud dashboards: Unified view across distributed teams (Testlio).
- Predictive reporting: Forecast release risks and regression failures.
Read more: AI in Software Testing 2025 – Key Trends
Data & Stats Snapshot
- Early bug detection saves up to 80% in remediation costs (BrowserStack)
- Top enterprises aim for 75–90% regression coverage (Capgemini)
- ROI can exceed 150% over 3 years (Forrester)
- 76% of QA leaders view analytics as critical to automation success (IDC)
Challenges in Test Automation Reporting & Analytics
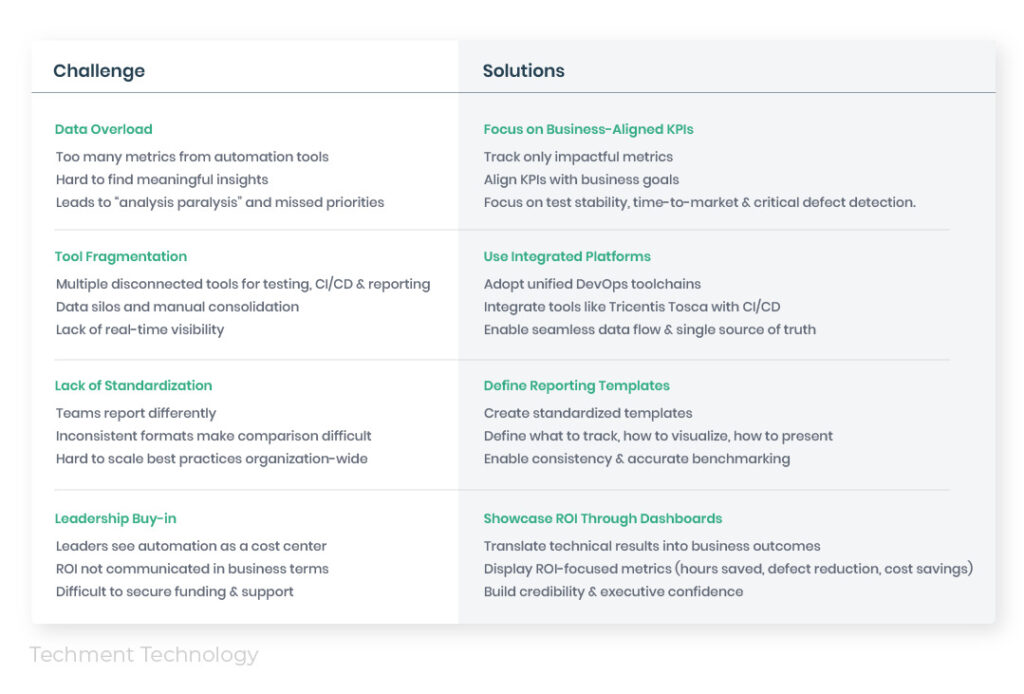
Challenge: Data Overload
A common challenge is being overwhelmed by a sheer volume of data. Automation tools can generate thousands of data points—from every test run to every line of code executed. This can make it difficult for teams to sift through the noise and find meaningful insights, leading to analysis paralysis where critical information is lost in a sea of metrics.
Solution: Focus on Business-Aligned KPIs
To combat data overload, the solution is to shift focus from vanity metrics to key performance indicators (KPIs) that align with business goals. Instead of tracking every single test status, concentrate on metrics that matter, such as test stability, time-to-market, or the number of critical defects found before release. By focusing on a few impactful metrics, teams can quickly get a clear picture of what’s working and what’s not.
Challenge: Tool Fragmentation
Many organizations use a variety of disparate tools for development, testing, and reporting. This tool fragmentation creates silos, making it difficult to get a holistic view of the testing landscape. Data from a test automation tool may not easily integrate with a project management or CI/CD platform, leading to manual data transfer and a lack of real-time visibility.
Solution: Use Integrated Platforms
The solution to tool fragmentation is adopting integrated platforms or a unified DevOps toolchain. For example, integrating a test automation tool like Tricentis Tosca directly with your CI/CD pipeline ensures that reporting data flows seamlessly and in real-time. This provides a single source of truth and automates the reporting process, eliminating the need for manual consolidation and offering a more cohesive view of your quality assurance efforts.
Challenge: Lack of Standardization
Without a standardized approach, different teams or even different individuals may report on test automation in unique ways. This lack of consistency makes it nearly impossible to compare results across projects, teams, or releases. It also makes it difficult to scale best practices and maintain a high level of quality across the entire organization.
Solution: Define Reporting Templates
To achieve consistency, define and enforce standardized reporting templates. These templates should specify which metrics to track, how to visualize the data, and how to present the insights. By using a consistent format, teams can easily share and compare results, enabling better collaboration and more accurate benchmarking.
Challenge: Leadership Buy-in
Gaining buy-in from leadership can be difficult, especially when the value of test automation is not clearly demonstrated in business terms. Leaders often view automation as a cost center rather than a strategic investment, leading to challenges in securing budgets and resources.
Solution: Showcase ROI Through Dashboards
The key to gaining leadership buy-in is to translate technical metrics into a business narrative. Create dashboards that showcase the ROI of test automation. Instead of showing the number of tests run, display metrics like “estimated hours saved on manual testing” or “reduction in critical defects post-release.” By linking test automation efforts directly to cost savings and improved efficiency, you can effectively justify your investments and secure ongoing support
FAQs
Q1. What are the key metrics in test automation reporting & analytics?
Metrics include test coverage analytics, bug detection efficiency, test execution reporting, defect density, and ROI of test automation.
Q2. How does test automation reporting improve ROI?
By quantifying time saved, cost reduced, and defects prevented, reports make ROI measurable and clear.
Q3. Which tools provide the best automation reporting?
Tools like TestRail, Tricentis Tosca, Katalon, and Testim provide robust reporting dashboards integrated with CI/CD pipelines.
Q4. Why is bug detection efficiency important?
Because catching bugs earlier reduces customer impact and cuts remediation costs by up to 80% (BrowserStack).
Q5. What challenges do teams face in reporting?
Challenges include data overload, tool fragmentation, lack of alignment, and difficulty in proving ROI.
Q6. Can AI improve test automation reporting?
Yes, AI-driven tools provide predictive defect analytics, anomaly detection, and trend forecasting.
Q7. How does test coverage analytics benefit QA leaders?
It ensures no critical functionality is left untested, improving release confidence.
Conclusion
Test automation reporting & analytics is the bridge between execution and strategy. It provides actionable insights for QA leaders, CTOs, and product managers to enhance efficiency, reduce risks, and prove ROI. By focusing on meaningful metrics and leveraging modern reporting tools, enterprises can drive both quality and speed at scale.
Contact us to implement test automation at scale.
Related Reads